We have provided several small example datasets for this short course, which have all been preprocessed to be in NetCDF4 format and on a regular latitude-longitude grid. The original datasets and instructions [1] are published [2] as part of the Online Laboratory for Data Compression in Climate Science and Meteorology [3].
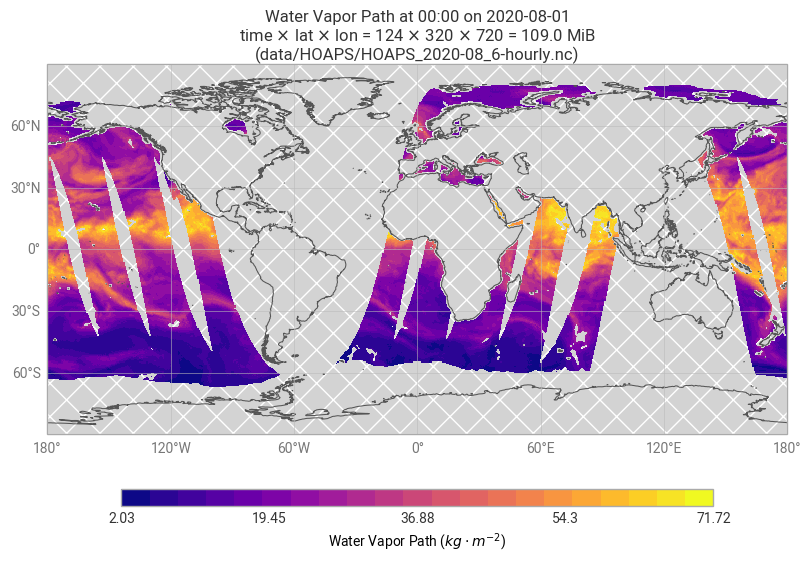
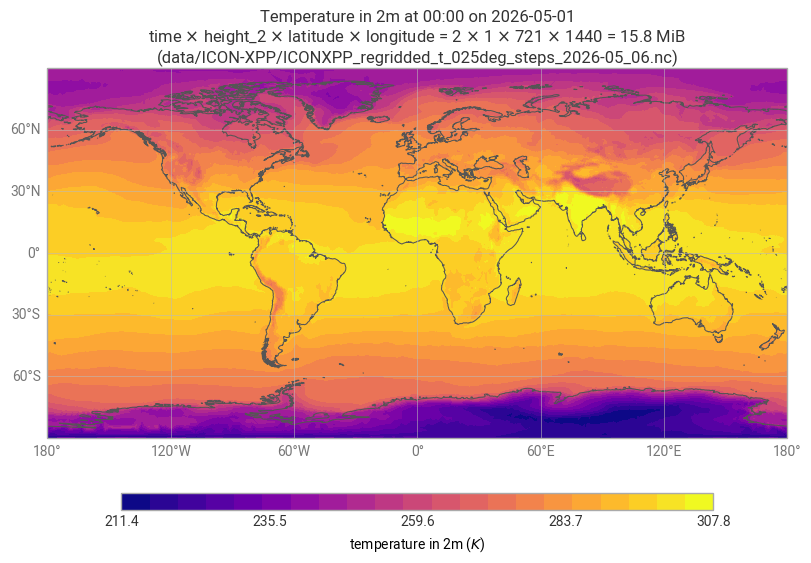
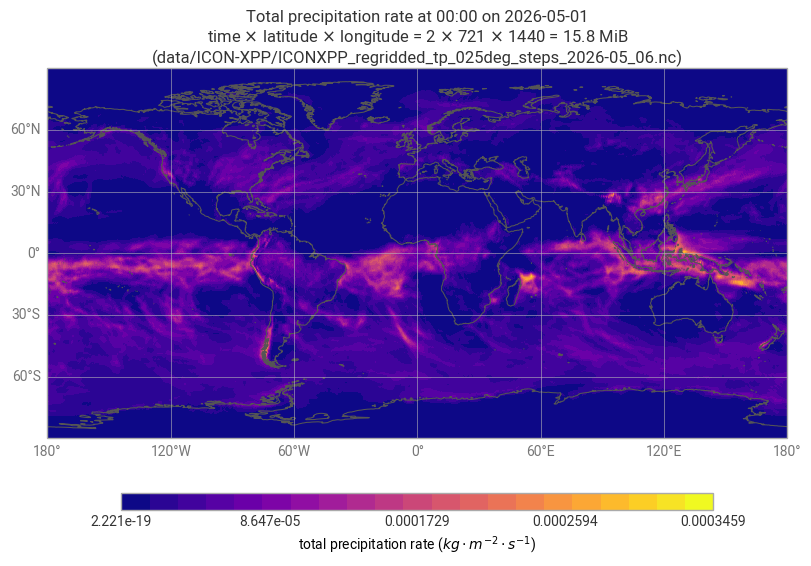
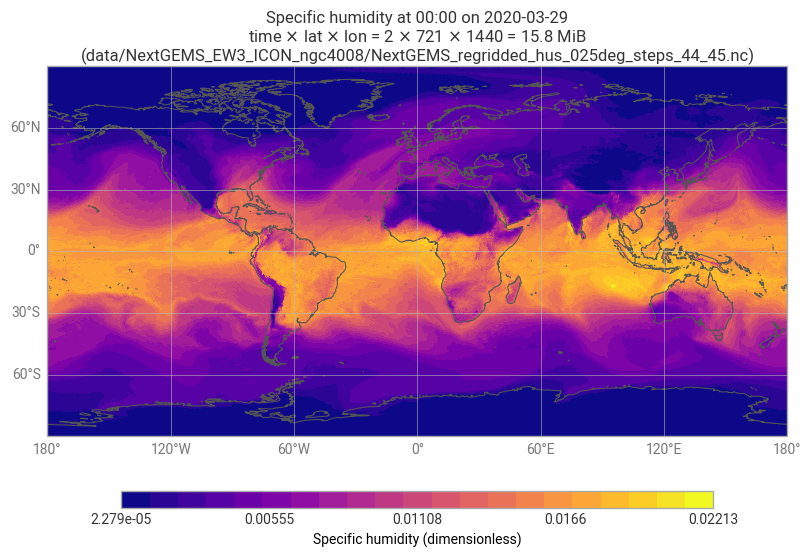
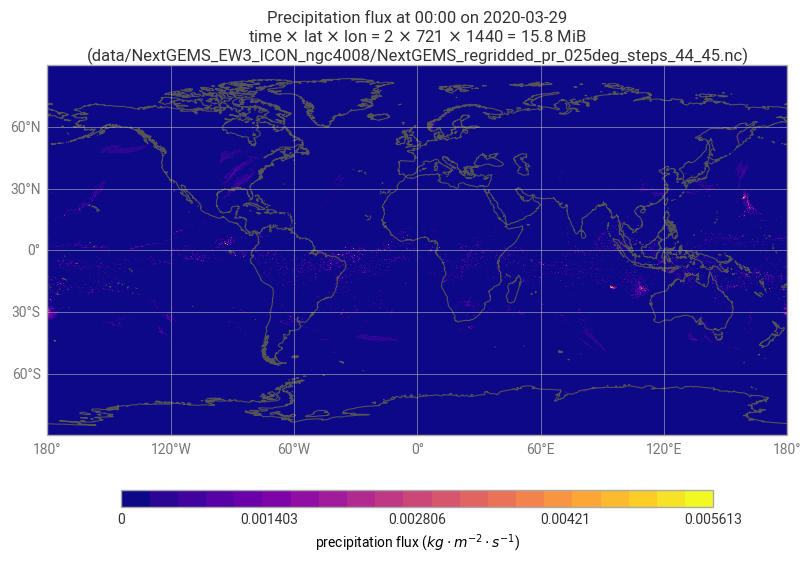
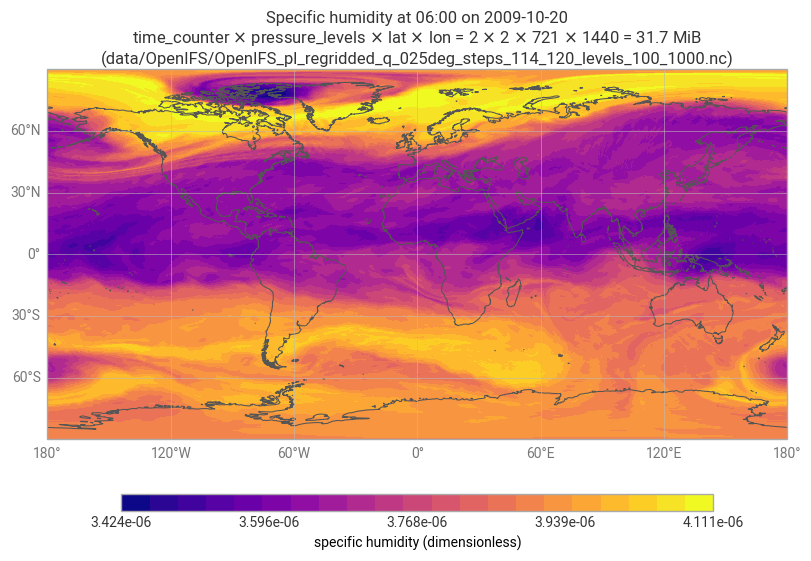
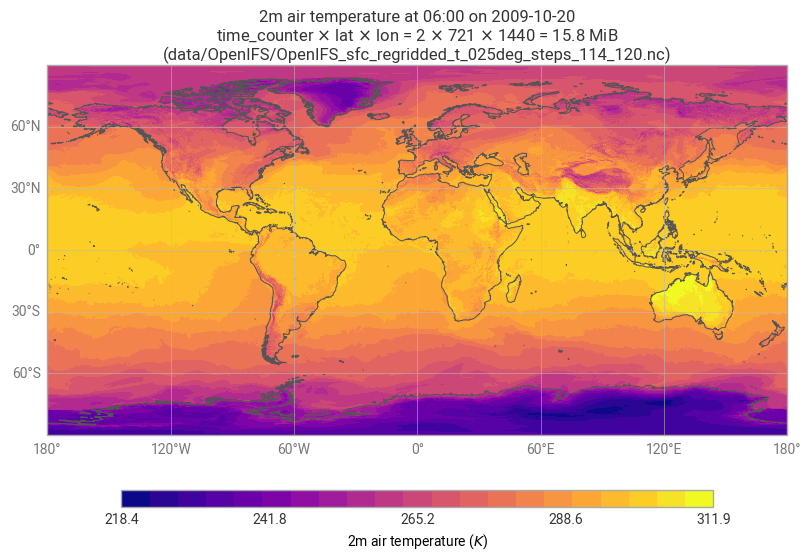
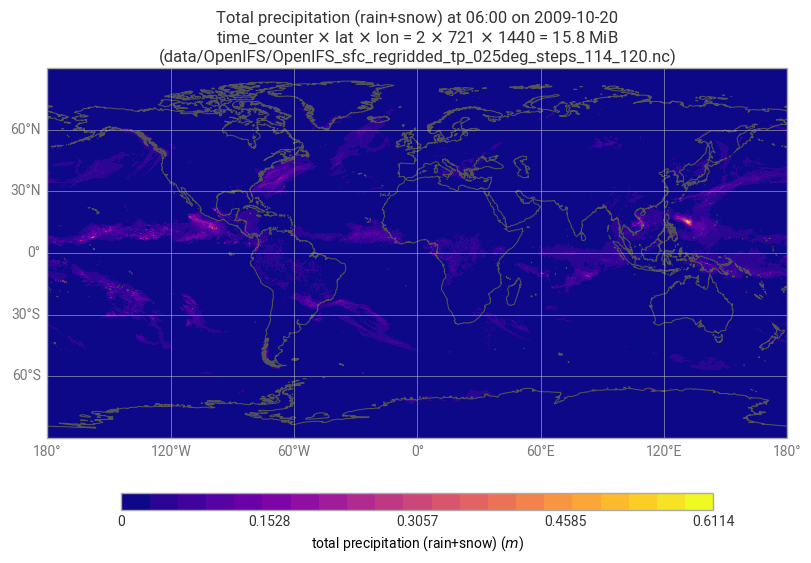
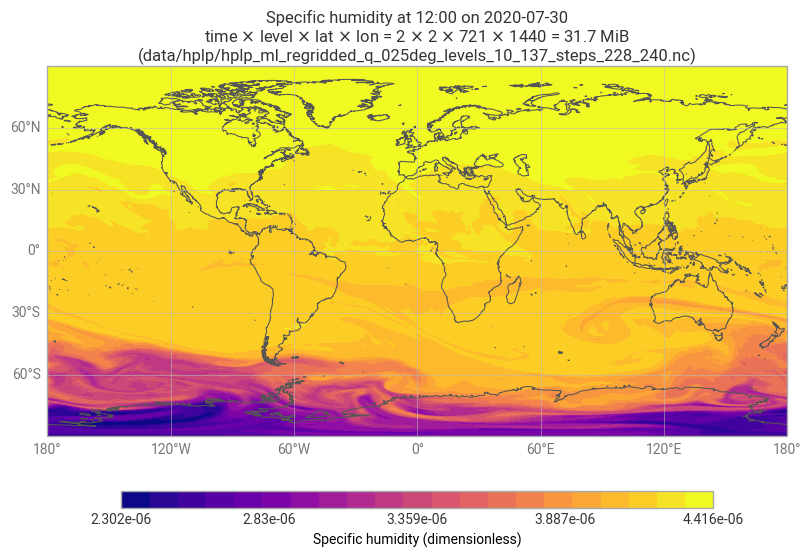
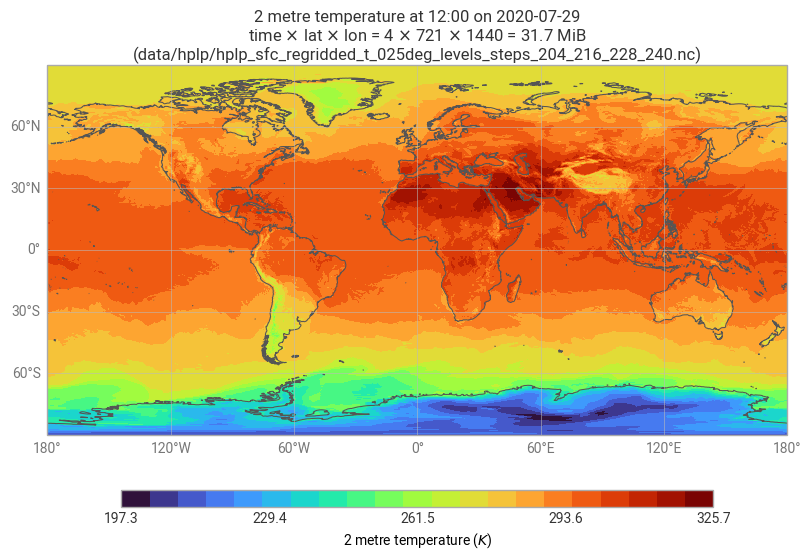
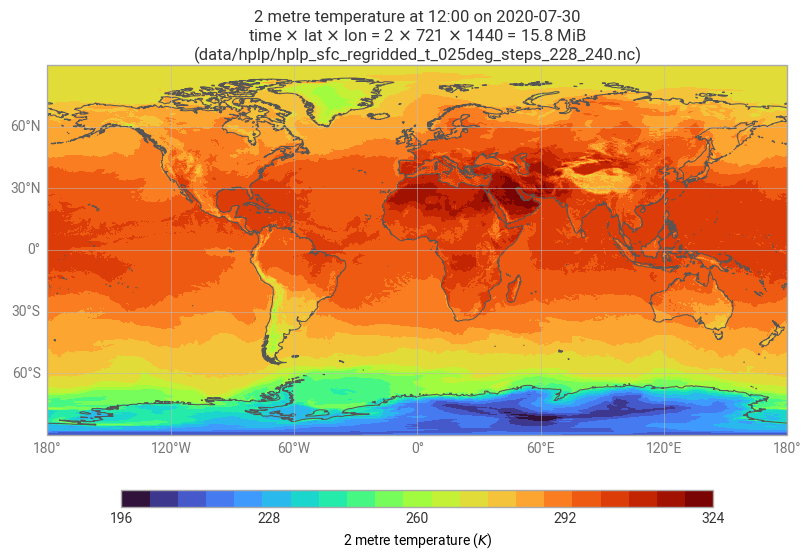
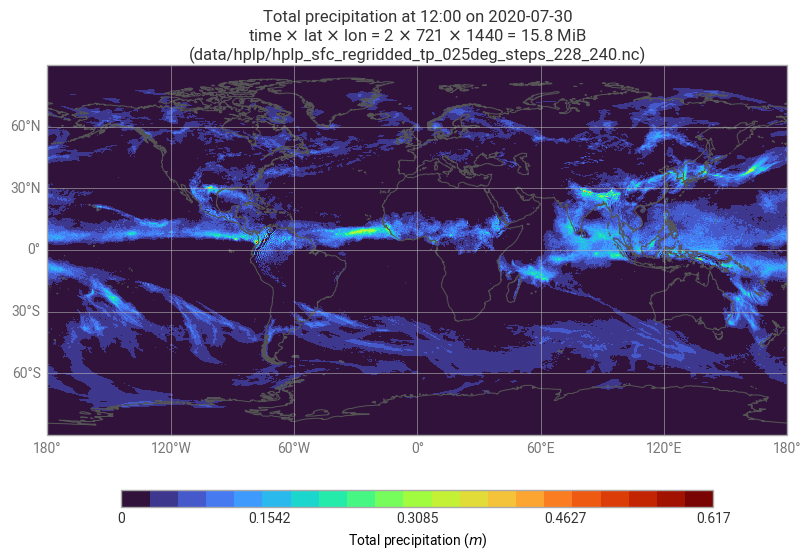
Here, we load all datasets using xarray and visualise them using our quickplot(da) helper function.
from pathlib import Path

import humanize
import netCDF4
import numpy as np
import xarray as xr
data = Path("data")import earthkit.plots
from quickplot import quickplotDATASET_PATHS = [
data / "HOAPS" / "HOAPS_2020-08_6-hourly.nc",
data / "ICON-XPP" / "ICONXPP_regridded_t_025deg_steps_2026-05_06.nc",
data / "ICON-XPP" / "ICONXPP_regridded_tp_025deg_steps_2026-05_06.nc",
data / "NextGEMS_EW3_ICON_ngc4008" / "NextGEMS_regridded_hus_025deg_steps_44_45.nc",
data / "NextGEMS_EW3_ICON_ngc4008" / "NextGEMS_regridded_pr_025deg_steps_44_45.nc",
data / "OpenIFS" / "OpenIFS_pl_regridded_q_025deg_steps_114_120_levels_100_1000.nc",
data / "OpenIFS" / "OpenIFS_sfc_regridded_t_025deg_steps_114_120.nc",
data / "OpenIFS" / "OpenIFS_sfc_regridded_tp_025deg_steps_114_120.nc",
data / "hplp" / "hplp_ml_regridded_q_025deg_levels_10_137_steps_228_240.nc",
data / "hplp" / "hplp_sfc_regridded_t_025deg_levels_steps_204_216_228_240.nc",
data / "hplp" / "hplp_sfc_regridded_t_025deg_steps_228_240.nc",
data / "hplp" / "hplp_sfc_regridded_tp_025deg_steps_228_240.nc",
]for path in DATASET_PATHS:
# all example datasets are regridded to regular latitude-longitude grids in NetCDF4 format
ds = xr.open_dataset(path, engine="netcdf4", decode_timedelta=True)
# most example datasets only contain a single variable
if "HOAPS" in path.parent.name == "HOAPS":
var = "wvpa"
else:
(var,) = list(ds)
da = ds[var]
quickplot(
da,
title=(
"{default_title}"
+ (
f"\n{r' $\times$ '.join(da.dims)} = "
+ f"{r' $\times$ '.join(str(s) for s in da.shape)} = "
+ f"{humanize.naturalsize(da.nbytes, binary=True)}"
)
+ f"\n({path})"
),
)
Faghih-Naini, S., Tyree, J., Yepes-Arbós, X., Karsten, P. G., Dueben, P., & Järvinen, H. J. (2025). ESiWACE3 Deliverable D3.3 - Report on the online version of the data sets. Zenodo. Available from: Faghih-Naini et al. (2025).
- Faghih-Naini, S., Tyree, J., Yepes-Arbós, X., Peters-von Gehlen, K., Dueben, P., & Järvinen, H. J. (2025). ESiWACE3 Deliverable D3.3 - Report on the online version of the data sets. 10.5281/ZENODO.14622238