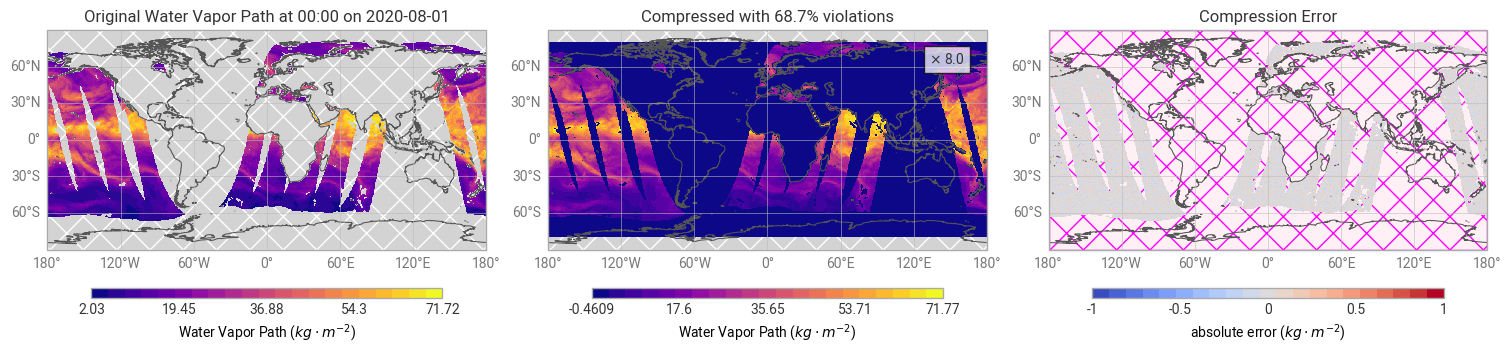
You are challenged to find a compressor that produces the highest compression ratio when compressing the provided satellite observation example dataset with an absolute error bound. The dataset contains missing values. The compressor must preserve the missing values and must not violate the error bound.
This product includes software produced by UChicago Argonne, LLC under Contract No. DE-AC02-06CH11357 with the Department of Energy.
from pathlib import Path

import netCDF4
import numpy as np
import xarray as xr
data = Path("data")import earthkit.plots
from quickplot import quickplotChallenge Configuration (do not edit)
# Load the data
ds = xr.open_dataset(
    data / "HOAPS" / "HOAPS_2020-08_6-hourly.nc",
    engine="netcdf4",
    decode_timedelta=True,
)
da = ds["wvpa"].sel(time=slice("2020-08-01", "2020-08-07"))
eb_abs_check = 1 # kg m-2Compressor Configuration (edit here)
eb_abs = 1 # kg m-2from numcodecs_wasm_zfp import Zfp
codec = Zfp(mode="fixed-accuracy", tolerance=eb_abs, non_finite="allow-unsafe")Challenge Evaluation (do not edit)
# encode and decode the data
da_enc = codec.encode(da.values)
da_dec = da.copy(data=codec.decode(da_enc, out=np.empty(da.shape, dtype=da.dtype)))
# plot a comparison figure
fig = earthkit.plots.Figure(
size=(15, 4),
rows=1,
columns=3,
)
# violation if
# (a) the absolute error bound is exceeded
# (b) missing NaN values are not preserved
violations = np.mean(
xr.where(
np.isnan(da),
~np.isnan(da_dec),
~(np.abs(da_dec - da) <= eb_abs_check),
)
)
violations = (
0
if violations == 0
else np.format_float_positional(100 * violations, precision=1, min_digits=1) + "%"
)
if violations == "0.0%":
violations = "<0.05%"
quickplot(da, fig.add_map(0, 0), title="Original {default_title}")
quickplot(
da_dec,
fig.add_map(0, 1),
title=f"Compressed with {violations} violations",
cr=da.nbytes / np.array(da_enc).nbytes,
)
quickplot(
xr.where(np.isnan(da) & np.isnan(da_dec), 0, da_dec - da).assign_attrs(
long_name="absolute error", units=da.units
),
fig.add_map(0, 2),
error=True,
vrange=(-eb_abs_check, eb_abs_check),
title="Compression Error",
)
fig.show()