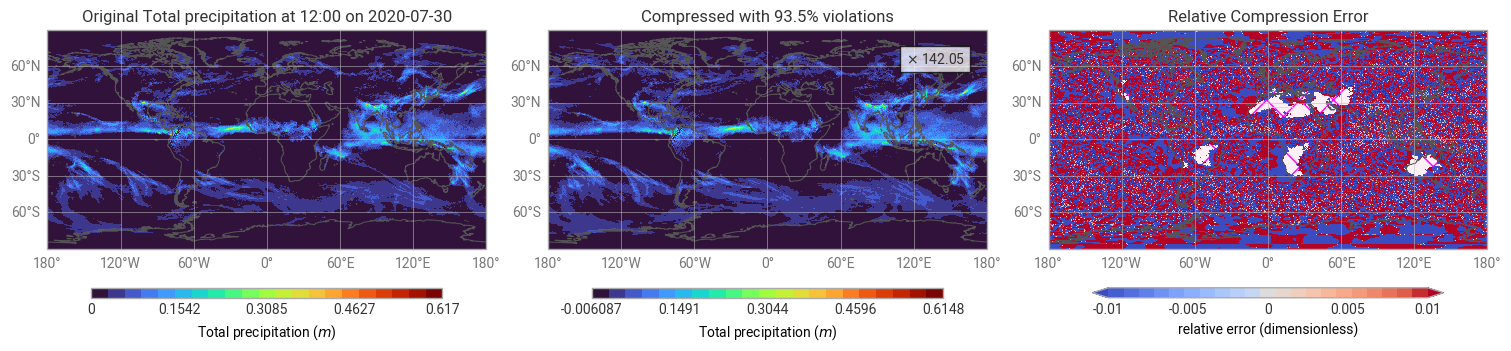
You are challenged to find a compressor that produces the highest compression ratio when compressing the provided precipitation example dataset with a pointwise relative error bound. The compressor must not violate the error bound.
This product includes software produced by UChicago Argonne, LLC under Contract No. DE-AC02-06CH11357 with the Department of Energy.
from pathlib import Path

import netCDF4
import numpy as np
import xarray as xr
data = Path("data")import earthkit.plots
from quickplot import quickplotChallenge Configuration (do not edit)
# Load the data
ds = xr.open_dataset(
    data / "hplp" / "hplp_sfc_regridded_tp_025deg_steps_228_240.nc",
    engine="netcdf4",
    decode_timedelta=True,
)
da = ds["tp"]
eb_rel_check = 0.01 # 1%Compressor Configuration (edit here)
eb_rel = 0.01 # 1%from numcodecs_wasm_sz3 import Sz3
codec = Sz3(eb_mode="rel", eb_rel=eb_rel)Challenge Evaluation (do not edit)
# encode and decode the data
da_enc = codec.encode(da.values)
da_dec = da.copy(data=codec.decode(da_enc))
# plot a comparison figure
fig = earthkit.plots.Figure(
size=(15, 4),
rows=1,
columns=3,
)
# violation if
# (a) the relative error bound is exceeded
# (b) incl if zero is not preserved
violations = np.mean(~(np.abs(da_dec - da) <= (np.abs(da) * eb_rel_check)))
violations = (
0
if violations == 0
else np.format_float_positional(100 * violations, precision=1, min_digits=1) + "%"
)
if violations == "0.0%":
violations = "<0.05%"
quickplot(da, fig.add_map(0, 0), title="Original {default_title}")
quickplot(
da_dec,
fig.add_map(0, 1),
title=f"Compressed with {violations} violations",
cr=da.nbytes / np.array(da_enc).nbytes,
)
quickplot(
xr.where(da == da_dec, 0, (da_dec - da) / np.abs(da)).assign_attrs(
long_name="relative error", units="%"
),
fig.add_map(0, 2),
error=True,
vrange=(-eb_rel_check, eb_rel_check),
title="Relative Compression Error",
)
fig.show()